- Home
- Documentation
- JCOM1939 Monitor - SAE J1939 Monitor, Analyzer, And ECU Simulator
JCOM1939 Monitor - SAE J1939 Monitor, Analyzer, And ECU Simulator
 The jCOM1939 Monitor Software is the perfect tool to monitor, analyze, and simulate SAE J1939 data traffic. The system combines our jCOM.J1939.USB ECU Simulator Board that functions as an SAE J1939 to USB (or UART) gateway. A comprehensive and easy-to-use, easy-to-understand Windows software displays not only SAE J1939 data traffic; it also allows to scan the network, simulate an ECU (incl. full node address negotiation features), and respond to data request messages.
- ECU Simulation Setup (Preferred Node Address, Negotiable Address Range, NAME, and more)
- Filter J1939 PGNs for Display
- Design J1939 PGNs for Transmission (Data and Request Messages)
- Design J1939 PGNs for Request Responses
- Scan a J1939 Network (Number of Nodes, Node IDs, NAMEs)
- Check Gateway Status (Error Messages, Software/Hardware Version)
- Set Gateway Parameters (Heartbeat Frequency, Message Acknowledgment)
- Free Updates
jCOM1939 Monitor Updates
 For a complete user manual and applicable firmware update information, please visit the Copperhill Technologies Wiki page.
User Manual...
Program Versions & Update...
Visual Studio C# Sample Code...
jCOM1939 Monitor - Hardware, Software, Driver Installation
Before you can run the software in combination with our jCOM.J1939.USB gateway, you need to install the drivers, wire the hardware, and install the jCOM1939 Monitor software.
Please proceed in the following order:
- Install the driver and wire the hardware.
- Install the jCOM1939 Monitor software (Windows only) - Run the .exe program and follow the instructions on the screen to install the program.
In some cases, it may be necessary to restart your computer after all these steps have been accomplished.
Note: All CAN settings (i.e. baud rate and 29-bit message identifier) are handled automatically by the software. The only "obstacle" is finding the COM port number that refers to your USB port; unfortunately, an auto-detect feature is not available at this time.
Note: The jCOM1939 Monitor will only work with our jCOM.J1939.USB hardware. It is not designed to work with any other hardware by any other manufacturer.
jCOM1939 Monitor - Main Screen

When you run the Windows software for the first time, you need to first select the COM port that relates to the J1939 Gateway. In the Windows Device Manager look for and select “Ports (COM & LPT)”. If the driver was installed successfully, you will see “Silicon Labs CP210x USB to UART Bridge” followed by the COM port associated with it. This is the port you must select in the Windows software. Should the software not show that particular COM port, please try again after rebooting the computer.
Also, it is mandatory that the simulator hardware is connected to a J1939 network. The simulator cannot send or monitor any data without being connected to a network.
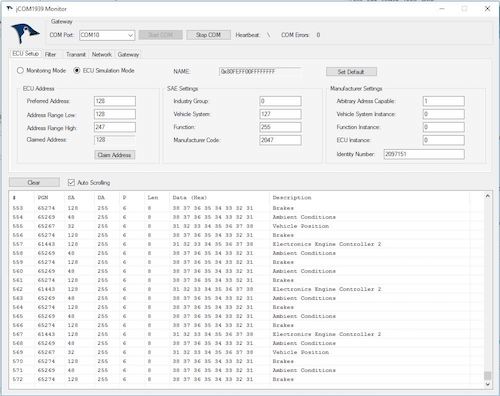
The jCOM1939 Monitor software for Windows contains of three main areas:
- On top you'll find the COM port section where you select the port number associated with your USB port. Click on Start COM to initiate the connection to the J1939 gateway. When the connection is made, you will see the Heartbeat bar changing in a one second interval. If the heartbeat does not change, please check that you have selected the correct COM port number and that you have a connection with the gateway. If this doesn't help, try with re-booting your computer.
- The next section is divided through several tabs such as ECU Setup, Filter, Transmit, Network, and Gateway. They are explained in the following chapters.
- The bottom section shows the SAE J1939 data as it is received or transmitted through the gateway.
In general, you can save the complete current setup to a file, or load an existing file by using the File menu items.
jCOM1939 Monitor - Data Display
As you can gather from the above image, the program lists all received PGNs according to the PGN filter settings. The displayed information includes:
- PGN Counter
- PGN
- Source Address - SA
- Destination Address - DA
- Priority
- Message Length
- Data
- Description (assigned in PGN filter settings as described below)
Special Case: Transport Protocol (TP)
Please be aware that the displayed priority will be 255 when a data frame of more than 8 bytes was received (TP - Transport Protocol). The Transport Protocol itself uses a Priority = 7 but it does not transmit the priority of the original message.
jCOM1939 Monitor - ECU Setup

If your intention is mere monitoring of SAE J1939 data traffic, you don't need to do anything here. This section is where you configure an SAE J1939 ECU through parameters such as Preferred Node Address, Negotiable Address Range, and the NAME setup. If you are not sure how to set the parameters, simply go with the default parameters. They are set up to have the ECU operate on the safe side without interfering with your J1939 network. Don't forget to click on the Claim Address command button before proceeding.
jCOM1939 Monitor - Filter Messages

The Filter section allows you to filter any PGNs (Parameter Group Numbers) from your network. Simply enter the PGN of your choice and a description (optional), then hit the Save command button. The PGN, provided it is part of your J1939 data traffic will show on the data screen below. If you are not sure which PGN to filter, you can also click on the Pass All option. This will give you an overview of all PGNs in the network, and you can chose which one to filter.
In order to modify a specific PGN, simply click on it in the table. All parameters will appear in the editing section. Modify the parameters to your liking, then hit Save again.
jCOM1939 Monitor - Transmit Messages

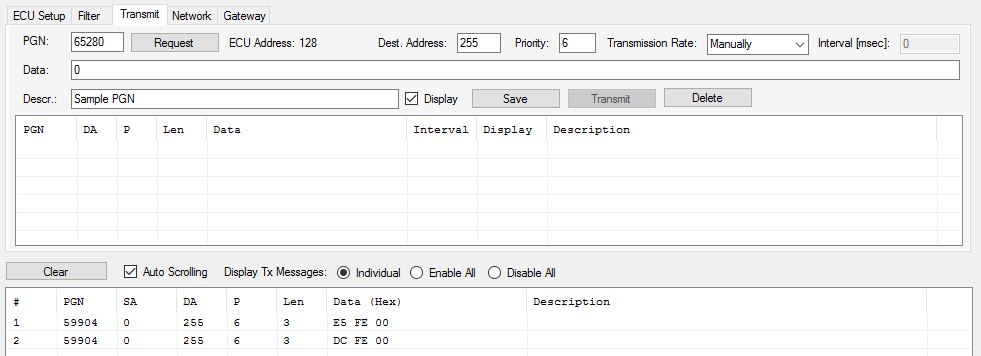
Please be aware that you can only transmit messages when you have chosen ECU Simulation Mode in the ECU Setup tab. Otherwise the software will indicate that there is no node ID available. You can design messages by entering the PGN, Destination Address (255 = Global Address = Broadcasting), Priority, Data, Transmit Interval (optional), and Description (optional).
Click the Save command button to transfer the PGN into the Transmit table. If you have entered a transmission frequency, you will see the PGN appear in the Receive window below. For single (manual) transmission, leave the Interval at zero, select the PGN in the table and click on the Transmit command button.
In order to modify a specific PGN, simply click on it in the table. All parameters will appear in the editing section. Modify the parameters to your liking, then hit Save again.
Display Option

In cases where you set up PGN transmission at high frequencies (e.g. 10 milliseconds) it doesn't really make sense to display the message on the screen, since the human eye will have problems following the data flow. Also, you will most likely miss other, received messages. For this case, the program offers a "Display" option. In addition, it also offers a display mode affecting all transmitted PGNs by providing options such as Individual (as assigned through the "Display" option), Enable All, or Disable All.
Transmit PGNs Using a Frequency

In case you want to transmit a PGN using a frequency, select the corresponding option in the "Transmission Rate" listbox, then enter the frequency in milliseconds and click Save. The program will automatically send the PGN using the assigned frequency.
Transmit PGNs Upon Request

In order to simulate an SAE J1939 ECU, it may be necessary to simulate the transmission of a PGN upon request. Edit the PGN as you would do with any regular PGN, but select "On Request" in the "Transmission Rate" listbox, the click Save. The message will be transmitted as soon as the program receives a request for it.
Setting Up a Request Message

A small set of PGNs are only available per Request message. In this example, we are setting up a request for "Engine Hours" - PGN 65253. Please not that you cannot set a frequency for request messages; the program will override any such entries. After editing the PGN, click on the Request command button (not the Save button).
The PGN for a Request message is 59904 and the data represents the requested PGN (LSB first, MSB last). All this reflects on the screen after hitting Request.

Transmitting Messages Longer Than 8 Bytes (TP - Transport Protocol)
The setup of a TP (Transport Protocol) message, i.e. a message with more than 8 data bytes, is identical to the process as described above, with the only exception that you cannot assign a transmit frequency, since TP messages are only transmitted after a Message Request. The number of transmitted data can be between 9 and 1785 bytes.
The USB gateway will automatically manage the switching between regular PGNs (8 data bytes) and a TP transmission.
jCOM1939 Monitor - Network Scanner

Please be aware that you can only scan the network when you have chosen ECU Simulation Mode in the ECU Setup tab. Otherwise the software will indicate that there is no node ID available. Click on the Scan Network command button, and the system will send a Request for Address Claimed message into the network. All other ECUs will respond and send their information, which will be displayed in the table.
jCOM1939 Monitor - Gateway Modus

The Gateway Modus allows you to check the communication between your Windows computer and the gateway. The information as displayed here is described in the manual for the jCOM1939 Protocol.
Note: The FLASH command button will set the gateway into programming mode, meaning it will cease its regular operation. The only way to resume regular operation is to reset the device per power-cycle (off-on). This feature can be used to load firmware updates into the device. Please check with the product page on this website for possible updates.
Switching the CAN Baud Rate
Starting with version 3.x, the jCOM1939 Monitor program allows the switching of the CAN baud rate between 250k and 500k.

Use the selector in the top right hand corner of the screen to select the baud rate. The default is 250k.
Please be aware that switching the baud rate requires the program to switch to mere monitoring mode (in case you already acquired a node address).
jCOM Demo Code for Visual Studio C#
For those who are interested in writing their own SAE J1939 application in combination with our jCOM J1939 ECU simulator board, we have created a demo program, representing a very simplified version of the actual monitor program. However, the demo program is available in full Visual Studio C# source code. Refer to Programming the SAE J1939 ECU Simulator Board Using Visual Studio C#.
A Comprehensible Guide to J1939
SAE J1939 has become the accepted industry standard and the vehicle network technology of choice for off-highway machines in applications such as construction, material handling, and forestry machines. J1939 is a higher-layer protocol based on Controller Area Network (CAN Bus).
It provides serial data communications between microprocessor systems (also called Electronic Control Units - ECU) in any kind of heavy duty vehicles. The messages exchanged between these units can be data such as vehicle road speed, torque control message from the transmission to the engine, oil temperature, and many more.
The information in this book is based on two documents of the SAE J1939 Standards Collection: J1939/21 - Data Link Layer J1939/81 - Network Management A Comprehensible Guide to J1939 is the first work on J1939 besides the SAE J1939 standards collection. It provides profound information on the J1939 message format and network management combined with a high level of readability.
 Loading... Please wait...

